How to connect to a detailed tutorial on data analysis directly from the browser in Tableau 2018.1
Tableau 2018.1 release
Recently, we officially launched Tableau 2018.1, which will provide data staff with great new features, including data connected to the Web. Expand your Tableau deployment faster, allowing business users on your team to use the browser directly to complete their analysis with a complete end-to-end production experience.
We are also pleased to introduce Dashboard Starters for Tableau Online. Dashboard Starters is a beautiful, data-rich dashboard in Tableau Online that is populated with data from popular business applications such as Salesforce.
What exciting new features have been brought to us by the new Tableau 2018.1? Let us look specifically at:
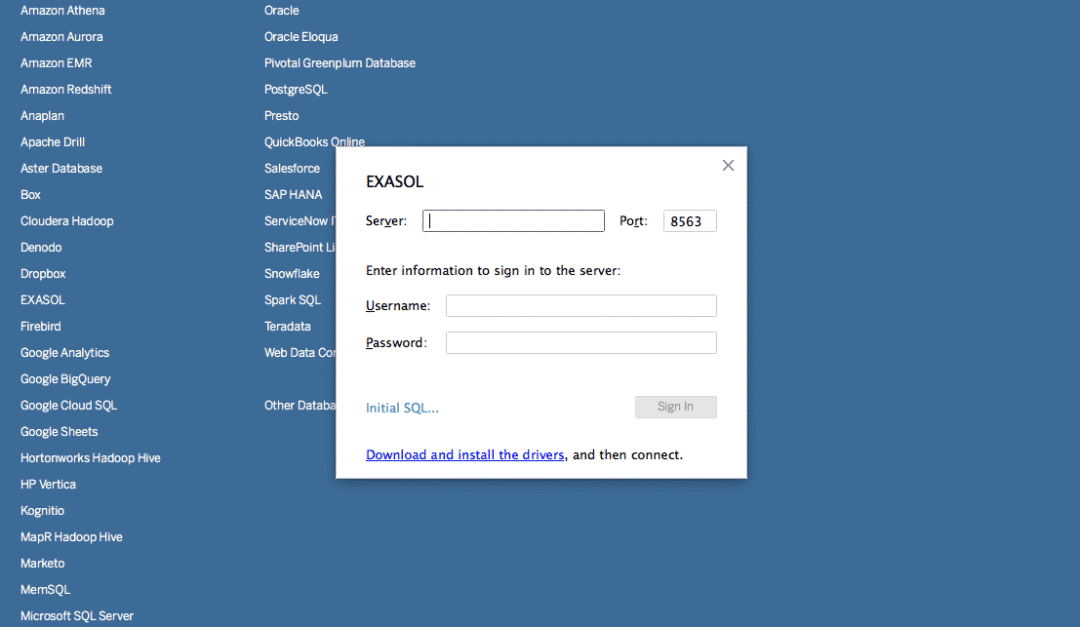
Connect to data directly from the browser
Tableau 2018.1 includes new Web authoring capabilities that can be used to connect from a browser to over 20 data sources, including SQL Server, Amazon Redshift, or a local data source such as Excel. Enjoy the seamless process of adding joins, creating visualizations and dashboards.
With a web-based analytics experience, businesses can quickly add users and deploy Tableau to thin clients, such as Chromebooks, while providing these users with a world-class Tableau production experience. And, because Web authoring is built into Tableau Server and Tableau Online, your organization's data will remain on Tableau's secure and controlled platform.
Dashboard Starters gives you instant insight
You can now get answers faster. Use Starters to process Eloqua, Marketo, Salesforce, and ServiceNow data to answer your business questions instantly. Starters are pre-built dashboards that populate your data when you connect in Tableau Online.
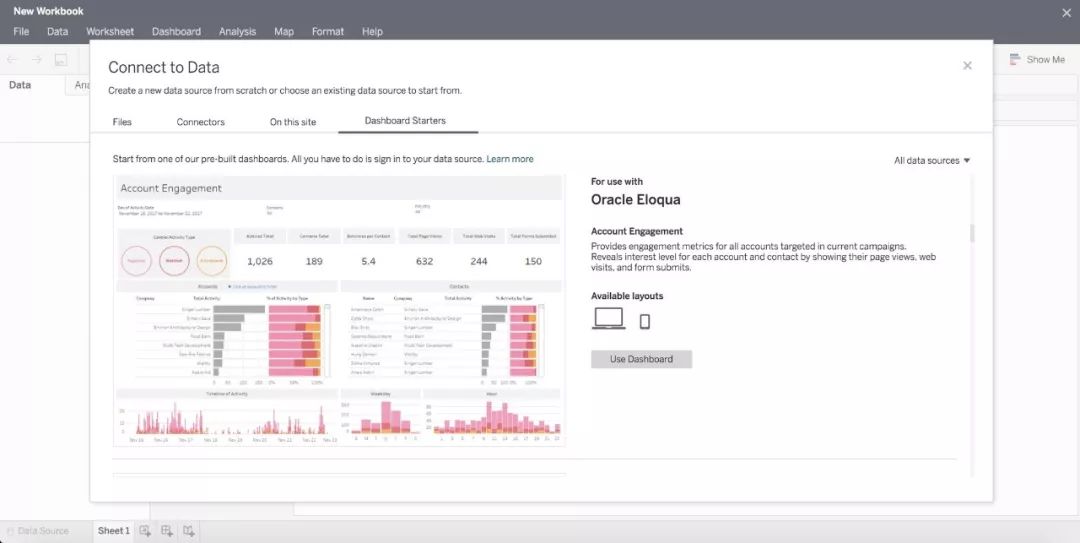
Because Dashboard Starters is a complete workbook, not a locked template, business users can use it to learn new data patterns or as a starting point for customizing their analysis.
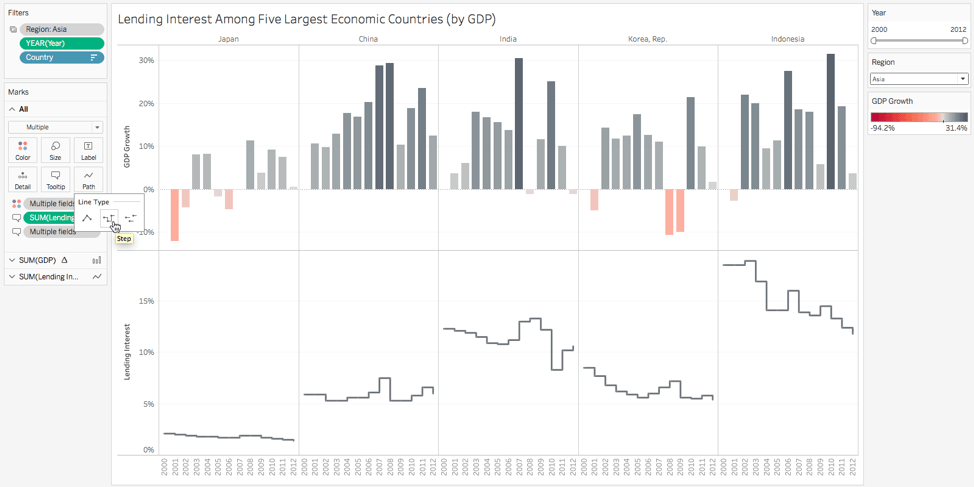
More ways to visualize data
You can now accurately display discrete data changes through ladder lines and jump lines. Use ladder lines to emphasize the size of the changes and use jump lines to show the duration of the change between points. You can now easily and accurately display changes in account balance data, inventory levels, and interest rates over time.
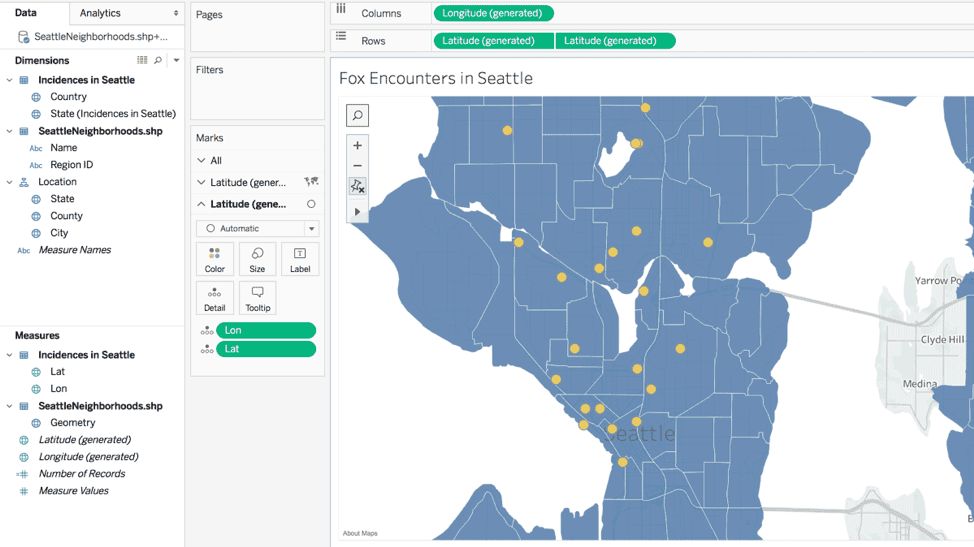
With the new map feature, you can combine custom latitude and longitude and generated latitude and longitude in two axes to generate multi-layer maps. You can now easily visualize and analyze spatial data by building multiple layers of maps.
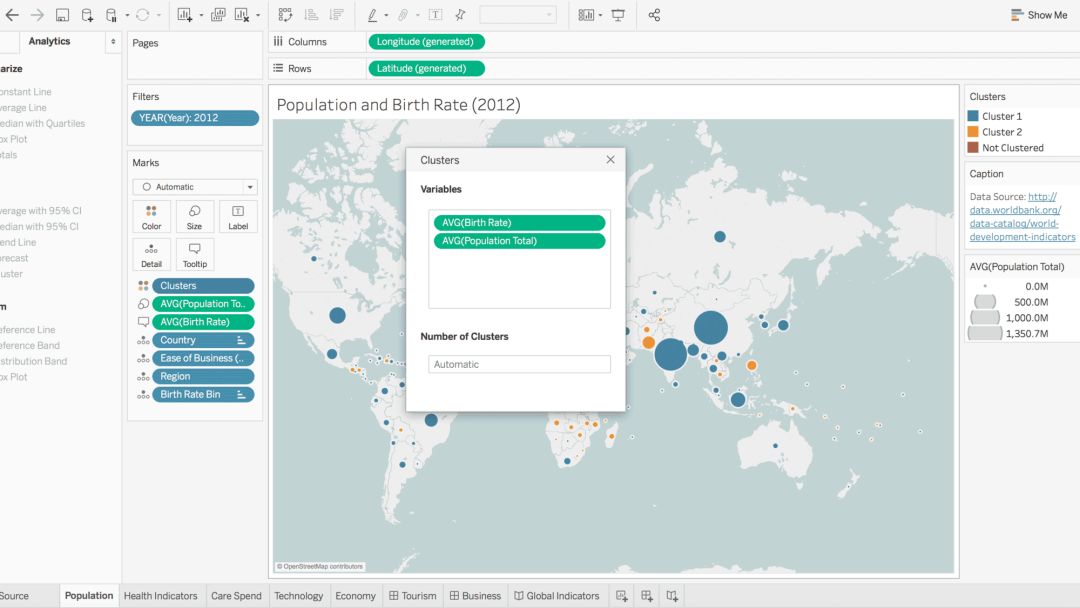
Saved cluster analysis results are no longer static results, so you can use cluster analysis in more locations. You can use saved clusters in different tables, and clusters can now be updated when the data is refreshed.
Tableau's filters now match the hierarchical structure in the data. Experience more efficient filtering operations using hierarchical filters with more powerful query performance.
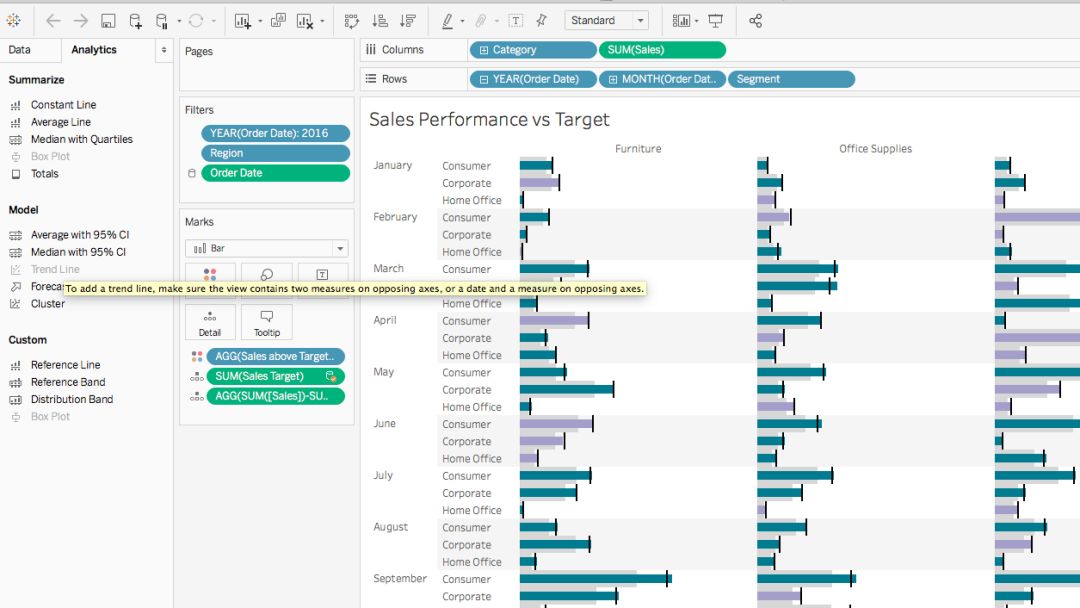
A better understanding of when the analysis object is available based on the status of the visualization. You can now see instructions for disabling analysis objects and learn how to activate these objects by updating the visualization.
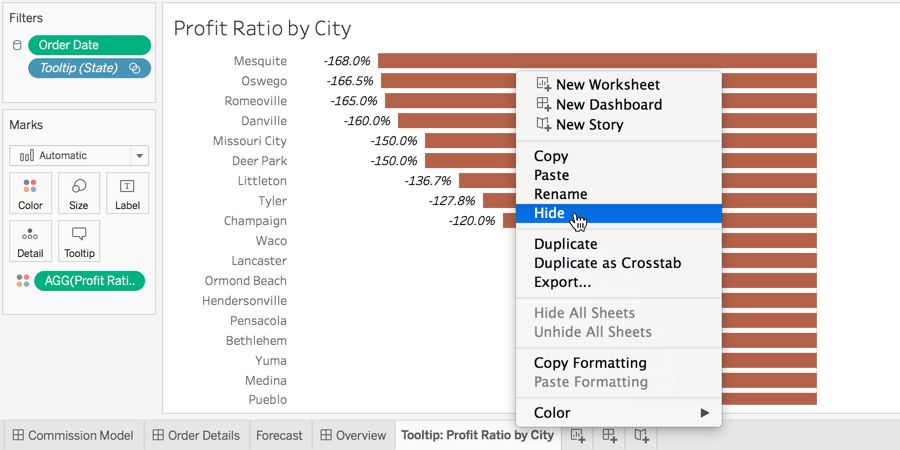
Hide the table for tooltip visualizations, the same way you would hide a story or dashboard.
More data features
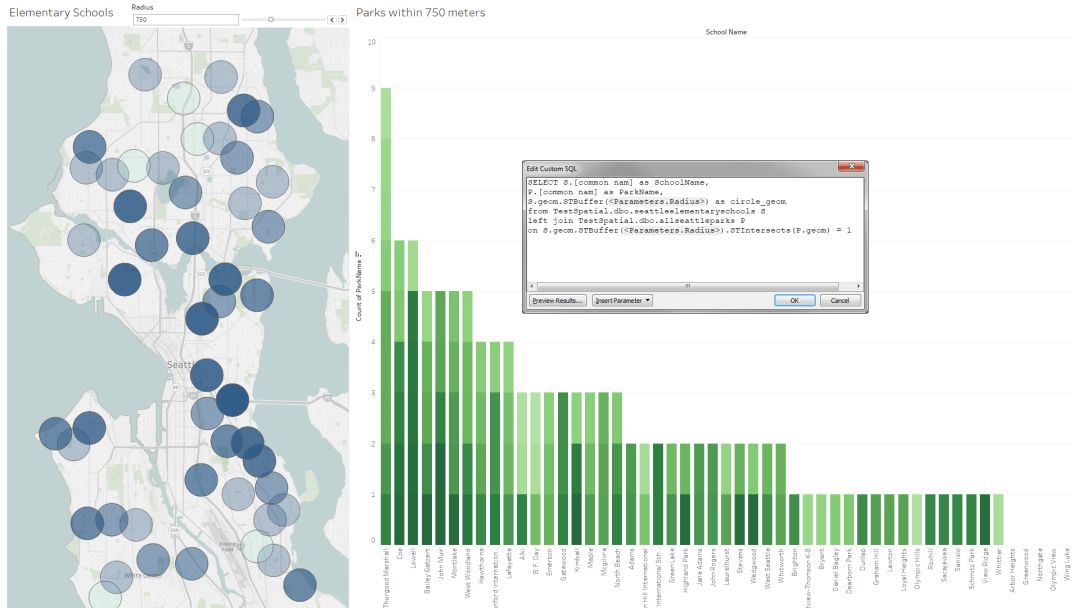
Directly connect to spatial data in SQL Server. Keep your live connection and use custom SQL to perform spatial operations in the database for advanced geospatial analysis.
You can use saved clusters in different worksheets, so you can use cluster analysis in more places. As the data is refreshed, the cluster is also updated to ensure that cluster analysis always uses the latest data.
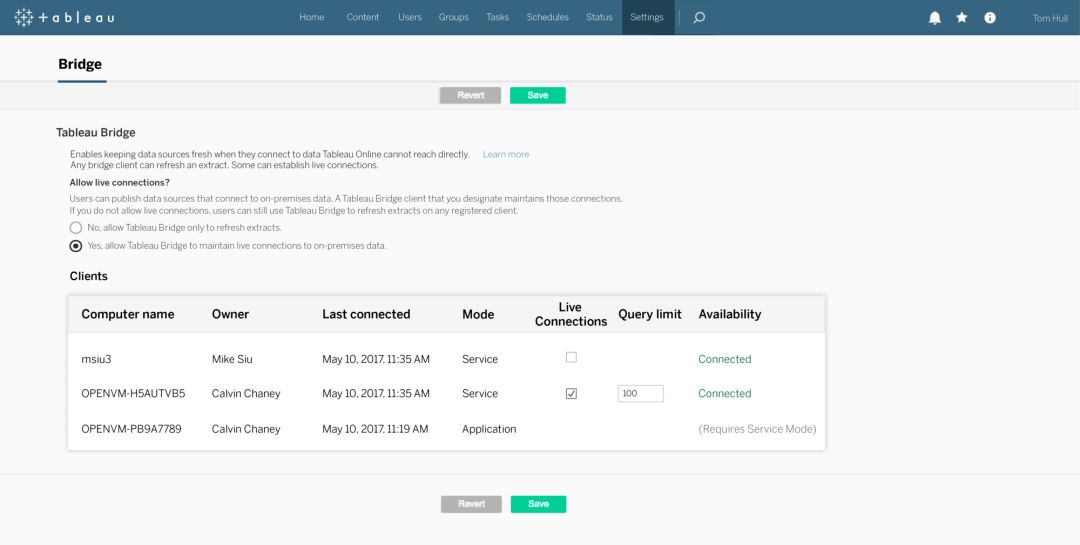
We also simplified the Tableau Bridge workflow. You can now trigger Tableau Bridge data extract refresh from your browser. Importing local data into Tableau Online is easier than ever.
More enterprise-level features
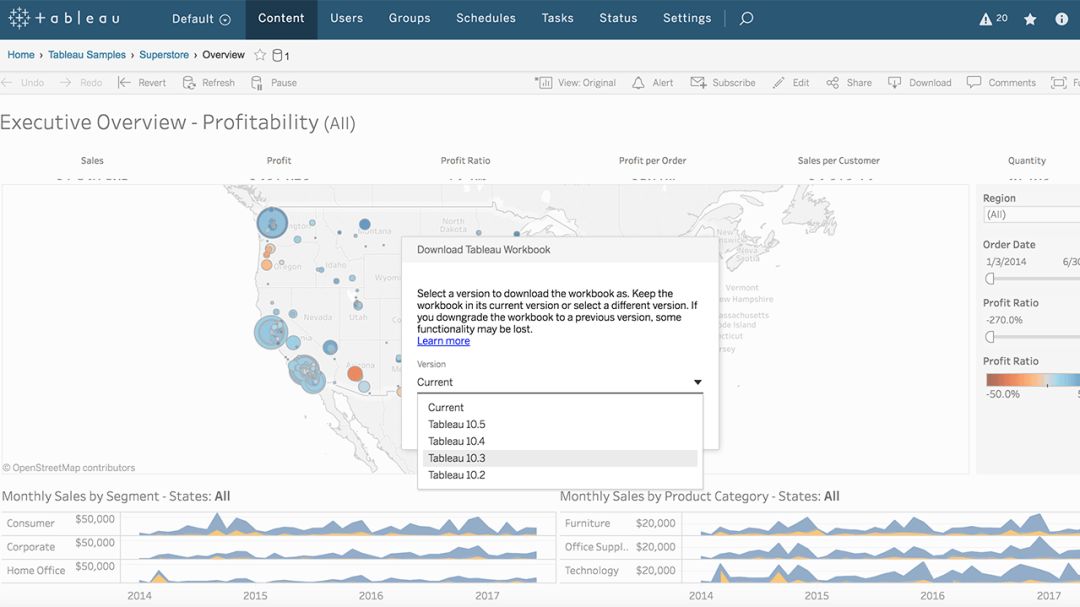
Tableau 2018.1 uses new security and governance features for large scale deployments. You can work more easily with different versions of Tableau. You can now download workbooks to use them in earlier versions of Tableau Desktop (minimum Tableau 10.2).
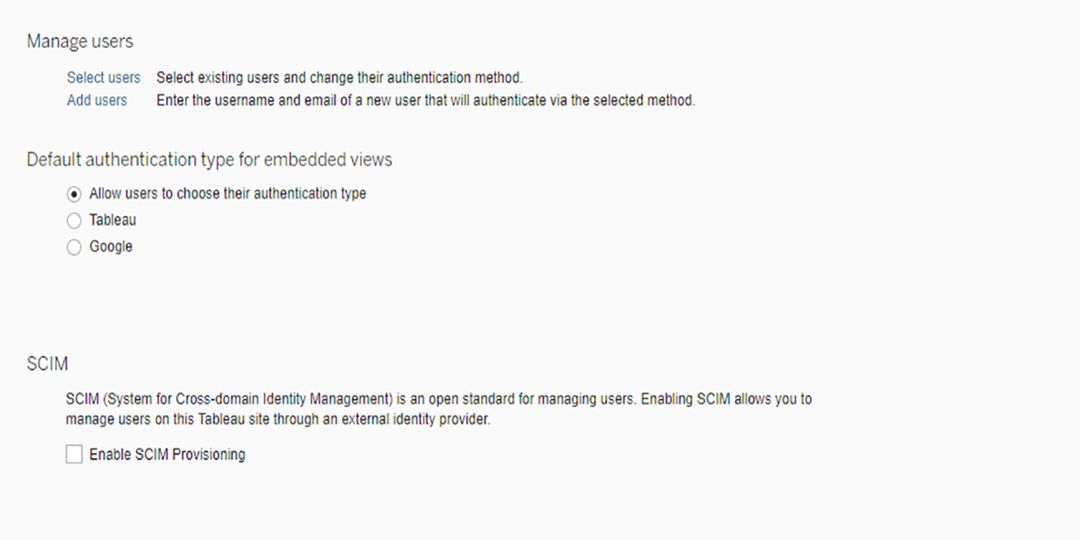
Automatic synchronization with your existing cloud ID management system simplifies the user permission licensing process. User permission permissions in Okta to grant or remove Tableau access rights seamlessly.
Get faster access to your data. If you need to install a driver to connect to a specific data source from Tableau Desktop, you will be notified in advance. Click on the URL to find and install the drivers needed for data analysis.
Android is an open source mobile operating system based on Linux platform released by Google at the end of 2007, and then improved for use in netbooks and MIDs. The platform consists of operating system, user interface and application software, and is claimed to be the first truly open and complete mobile software for mobile terminals.
To put it simply, the Android system is actually a very open system. It can not only realize the functions of the most commonly used notebook computers, but also realize various directional operations like mobile phones. Moreover, it is specially designed for mobile phones. The operating system developed for equipment has advantages in system resource consumption and human-computer interaction design. It is an operating system that combines traditional and advanced advantages.
New Android Tablet,Android Tablet,New Android Tablet
Jingjiang Gisen Technology Co.,Ltd , https://www.gisentech.com