Traffic light control system based on machine vision recognition
**1. Introduction**
Machine vision, also known as computer vision, is a technology that enables machines to simulate human visual functions, allowing them to perform measurements and make judgments instead of relying on human eyes. This field integrates various technologies such as lighting illumination, optical imaging, sensor systems, digital image processing, mechanical engineering, detection and control, video signal processing, computer science, and human-machine interface design. These are the core components that enable machine vision systems to function effectively.
The ability to recognize traffic lights can significantly benefit individuals with color vision deficiencies—approximately 7 to 8% of the global population. It not only allows them to drive safely but also supports the development of autonomous vehicles. This advancement has the potential to bring substantial economic and social benefits to the automotive and electronics industries, while also addressing a critical gap in this technological domain.
**2. Traffic Light Recognition Method Based on Machine Vision**
**2.1. Flow Chart of the Traffic Light Recognition Method**
The following diagram illustrates the overall process of traffic light recognition using machine vision:
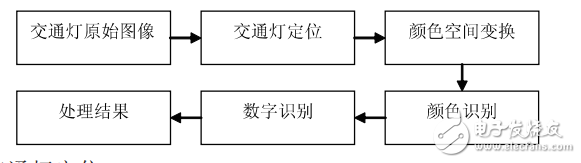
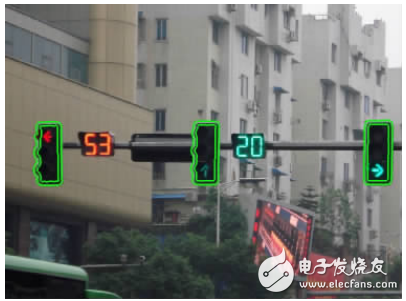
Figure 2-1: Locating the traffic light based on shape
**2.3. Color Space Conversion** After identifying the location of the traffic light, the next step is to determine its color. RGB color space is not ideal for color similarity due to its lack of perceptual uniformity. Therefore, we convert the image to the HSI (Hue, Saturation, Intensity) color space, which better aligns with human perception. The general conversion formula from RGB to HSI is as follows: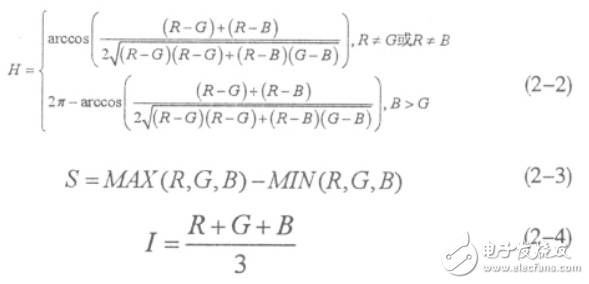
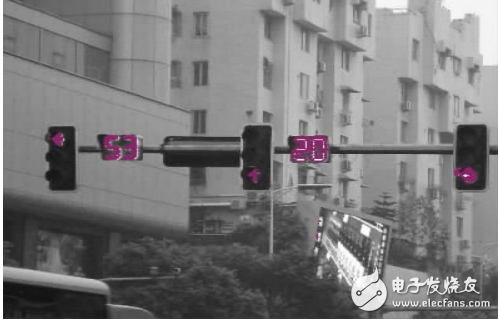
Figure 2-2: Extracting traffic light information through saturation
**2.4. Color Recognition** To identify the color of the traffic light, we use image segmentation techniques. After applying a threshold, the desired regions are extracted from the image. **2.4.1. Threshold-Based Segmentation** Threshold-based segmentation is one of the most widely used methods for separating different regions in an image. It involves selecting a threshold value to distinguish between foreground and background. If the image contains only two regions—target and background—a single threshold is sufficient. However, when multiple targets exist, multi-threshold segmentation is required. The choice of threshold is crucial, as it directly affects the quality of the segmentation. Under conditions where the background and target have equal prior probabilities, the optimal threshold is the average of the mean gray values of the background and the target. This is expressed as: $$ T = \frac{\mu_{\text{background}} + \mu_{\text{target}}}{2} $$ This approach ensures that the segmentation results are more accurate and reliable.Cixi Xinke Electronic Technology Co., Ltd. , https://www.cxxinke.com